For two years this work read the chip supply chain as a sequence — Japan leading Taiwan, Taiwan leading Korea, a lag you could trade on. Testing it killed that idea. Then a wider look brought a different version of it back, with one catch: the cycle is still there, but right now it can't be read.
The semiconductor supply chain has an obvious shape. Japan ships the materials, Taiwan fabricates, Korea supplies the memory. Lay it out left to right and it looks like a sequence — and if it's a sequence, movements should propagate down it. Japan should lead Taiwan, Taiwan should lead Korea, and somewhere in the lag between them sits a leading indicator: a clock for the whole industry.
That clock was the assumption underneath the first two years of this work — the synchronization charts, the ripple index, the data pulled and shaped to catch one region tipping before the next. This column is about taking it apart, and then about what survived. Because the first half of that story is a clean failure, and the second half is the most useful thing in it.
What the data did to the idea
The idea is testable, so it got tested — with the same falsification discipline I'd want from anyone asking me to trust their signal.
The first candidate looked promising. Japanese wafer exports against Korean exports showed a correlation of 0.51 at a three-month lag — Japan appearing to lead Korea by a quarter. On a small sample, that's the kind of number people build products around. Then the sample expands from 27 months to 159, with month-over-month detrending to strip out the shared trend — and the signal vanishes. No longer significant. What looked like Japan leading Korea was two series riding the same underlying AI cycle, with base effects faking a lead.
The second candidate was a Taiwan-leads-Korea signal that had been live on the site, labeled — to its credit — "Weak." It was r=0.344 on 25 months. Taiwan isn't a clean trade reporter, so the history can't be extended, and across every lag the available months never produced a significant correlation; the strongest was 0.17. The reverse direction looked better at first — 0.74 — until the sign flipped back and forth across lags, the fingerprint of a reporting-timing artifact, not a real lead.
The verdict got clearer the deeper it went: Taiwan and Korea aren't early-and-late stages of one chain. They're different markets. Taiwan — AI logic and foundry — grew steadily, +35% to +61%. Korea — the memory cycle — swung from −6% to +56%. One can't lead and the other lag when they're measuring different things.
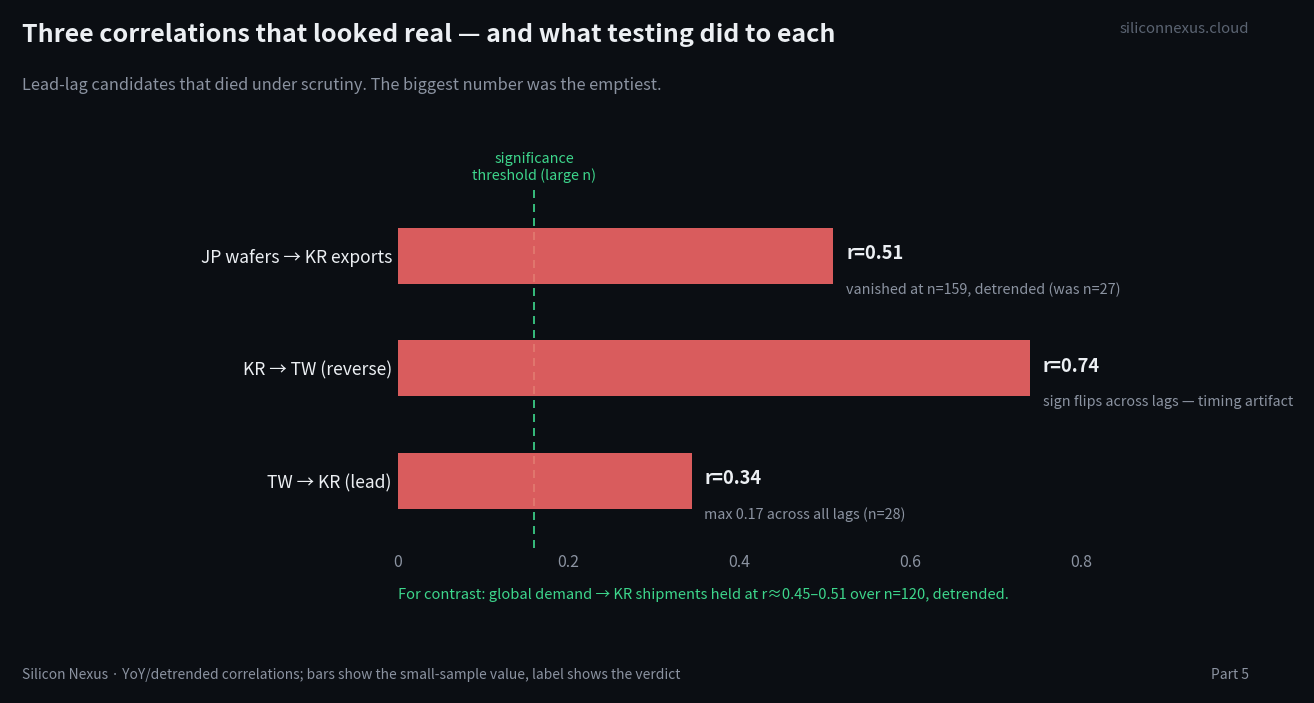
So the linear chain is dead. Not softened — dead.
The pivot, and the dead end
If it isn't a line, it's a Y: Japanese materials don't flow down a chain, they split — feeding Korean memory on one arm and Taiwanese logic on the other, the two arms running in parallel and meeting downstream at the packaging chokepoint and the chip designers. That reframe is sound, and it's the spine of Part 4. But a shape is only useful if it can be measured — so the next move was to go looking for the data that would turn the Y into live signals, at the joint where the cash changes hands.
That search mostly hit dead ends, and the dead ends were instructive. The cleanest test — does a designer's prepayment show up as a supplier's contract liability before the goods ship — broke on the data: the prepayment figure sits bundled inside a grab-bag balance-sheet line that doesn't isolate it, and the supplier side pools every customer into one number that can't be split. The Japanese materials arm, where the trade data is genuinely clean, turned out to be mostly structure and noise — of seven flows, six were flat or random, and exactly one drifted in a way worth watching. Not nothing. But not a clock.
At which point the honest move was to stop forcing the recent data and ask a question I'd skipped.
The question I'd skipped
The AI boom is about four or five years old. Semiconductors were the textbook cyclical industry for the decades before that — boom, glut, cut, recovery, on a clock everyone in the business could feel. If a lead-lag structure ever existed, it would show up there, in the long record, not in the thin slice since GPT-3. So the scope widened again — back past the boom, into the downturns.
And there it was.
Global semiconductor demand led Korean memory shipments by four to six months across 2012–2022 — and this one survived the gauntlet: year-over-year, detrended, r=0.45–0.51 over 120 months, not 25. A second, independent path said the same thing. Hyperscaler capital spending led memory makers' operating income in the pre-AI years — cleanest at Micron (r=0.64–0.75) and SK Hynix (r=0.71–0.79). And the oldest mechanism of all held in both eras: when memory shipments rise, prices fall, a textbook inverse that stayed robust at r=−0.67 to −0.76 straight through the AI boom. The cycle's engine never stopped turning.
So the clock was real. Which raises the harder question: if it was real, why couldn't it be found in the recent data?
Why you can't read it now
Because every hand on the dial is pointing the same way.
In the pre-AI record, the lead was legible because the series took turns — demand turned, shipments followed a couple of quarters later, prices reacted after that. In the AI era, every one of those series is surging at once. Run the same correlation on 2023-onward and the lag doesn't vanish — it saturates: every lag from zero to three quarters reads above 0.7, which means none of them is distinguishable from the others. The clock didn't stop. All the hands are sweeping together, and you can't tell which one is leading.
This is also where testing earns its keep by killing the fakes. Run hyperscaler capex against NVIDIA's operating income in the AI era and you get a strong negative correlation, −0.78 — which, taken at face value, says more investment means less profit for NVIDIA. That's absurd; both are exploding. The culprit is a base effect. NVIDIA's profit isn't falling — it's that a company which went from 30 to 90 (a +200% year) and then to 95 (a +5% year) shows a collapsing growth rate while its actual profit keeps climbing. Line that decelerating growth rate up against still-accelerating capex and the math spits out a confident minus sign that means nothing. Catching that — refusing to print the −0.78 as a finding — is half of what validation is for.
Following the structure instead
If the clock can't be read in this regime, the thing to hold onto is what doesn't change with the regime: somebody orders and pays, somebody builds and delivers. Orders sit at the top of the chain; delivered profit lands at the bottom, a couple of quarters later. The space between them is demand that's been committed but not yet earned — and that space, in principle, is information.
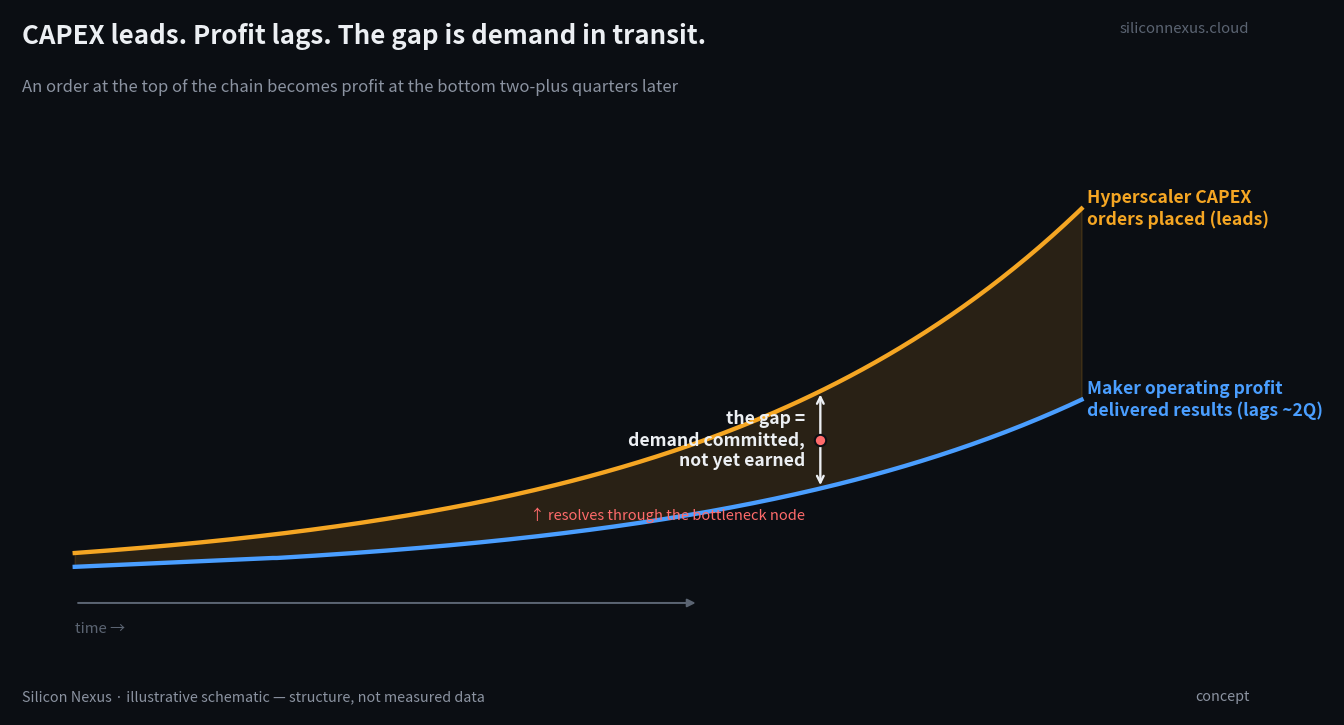
That's the picture. Here is what the actual numbers do to it.
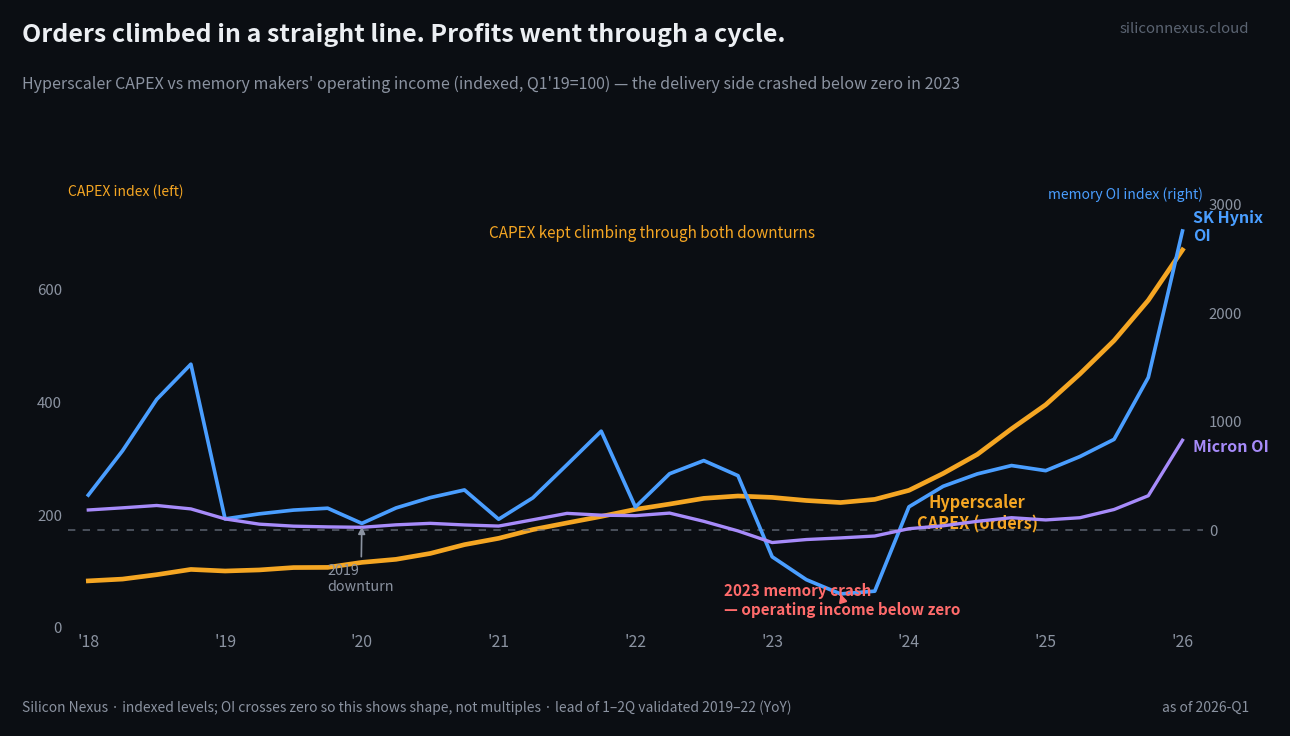
The clean wedge doesn't survive contact with the data. Capital spending climbs in a near-straight line through every downturn, but the delivery side — memory operating income — isn't a smooth lagging echo. It's a saw. It boomed in 2018, fell in 2019, and went deeply negative in the 2023 memory crash, even as orders kept rising. The gap is real, and the order-to-profit lead is real where it was tested. But the delivery side is a cycle that crosses zero, not a curve that trails politely behind. The structure holds; the picture I'd drawn of it was too tidy.
Where that leaves the work
So, plainly: the chain isn't a clock you can read off a single chart, but it isn't clockless either. The cyclical lead-lag that defined this industry for decades is still in the machinery — confirmed in the long record, by two independent paths, with the core price mechanism intact. It just can't be read in a regime where everything rises together. The instrument that would let you read it again is a downturn, and the AI cycle hasn't had one yet.
What follows from that is unglamorous and, I think, correct. Don't pretend the lag is legible right now; it isn't. Track the relationships that survived testing — orders leading memory profit by a quarter or two, shipments and prices on their inverse leash — and treat them as a frame, not a trigger, until a real cycle turn lets the lag separate again. Keep the coarse instruments labeled as coarse, the way the rejected indicators now sit relabeled on the site instead of quietly deleted. Promote a signal only when the data is long enough to earn it.
The first version of this argument was that the clock was gone. The data corrected that — it isn't gone, it's drowned out — and following the data into a less satisfying, more accurate answer is the whole job. When the tide goes out, the hands on the dial will spread apart again, and the lead will be there to read. Until then, the honest move is to watch the structure, name what can't yet be measured, and wait for the cycle to do what cycles do.
This is opinion, not investment advice. Figures are drawn from primary filings and trade statistics, fact-checked as of writing; the interpretation — and the corrections — are my own.
If this analysis was helpful · ☕ Support Us · ✈️ Telegram